
Top Posts of 2012
Updated: 2012-12-31 11:00:53
R-bloggers R news and tutorials contributed by 425 R bloggers Home About add your blog Contact us RSS Welcome Here you will find daily news and tutorials about R contributed by over 400 bloggers . You can subscribe for e-mail updates And get updates to your Facebook : If you are an R blogger yourself you are invited to add your own R content feed to this site Non-English R bloggers should add themselves- here TOPICS OF INTEREST ggplot2 graphics rstats r-project programming R Language visualization Books Data R-english events tutorial Big Data LaTex finance packages ggplot applications Software Simulation sweave Tutorials stocks R Chemometrics Climate Trends computing plot Bioinformatics stats R Programming random Python Quant finance lattice Global Warming Rmedia Time Series Charts science
 This is a quick update for a previous post on Graphing Non-Proportional Hazards in R. In the previous post I showed how to simulate and graph 1,000 non-proportional hazard ratios at roughly every point in time across an observation period. In the prev...
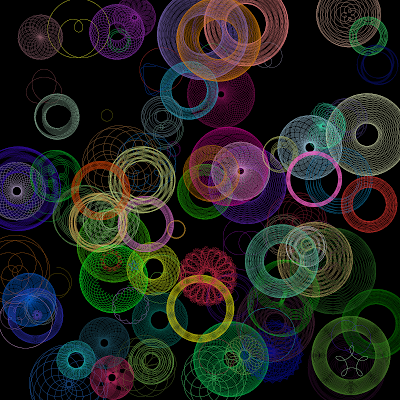 Just had to figure out how to replicate this old toy of mine with R! I had no idea how long it's been around:Read more »
 Curious about Mathematica 9? You can see it in action in three free online events. Our experts will introduce you to new features in usability, computation, data manipulation, and visualization. Live Q&A sessions during each event will give you a chance to ask questions. Topics covered: Predictive Interface and Units: December 10, 1–2pm EST Get [...]